# Dashboard
The Nimbus dashboard providers a birds eye view of your Nimbus installation.
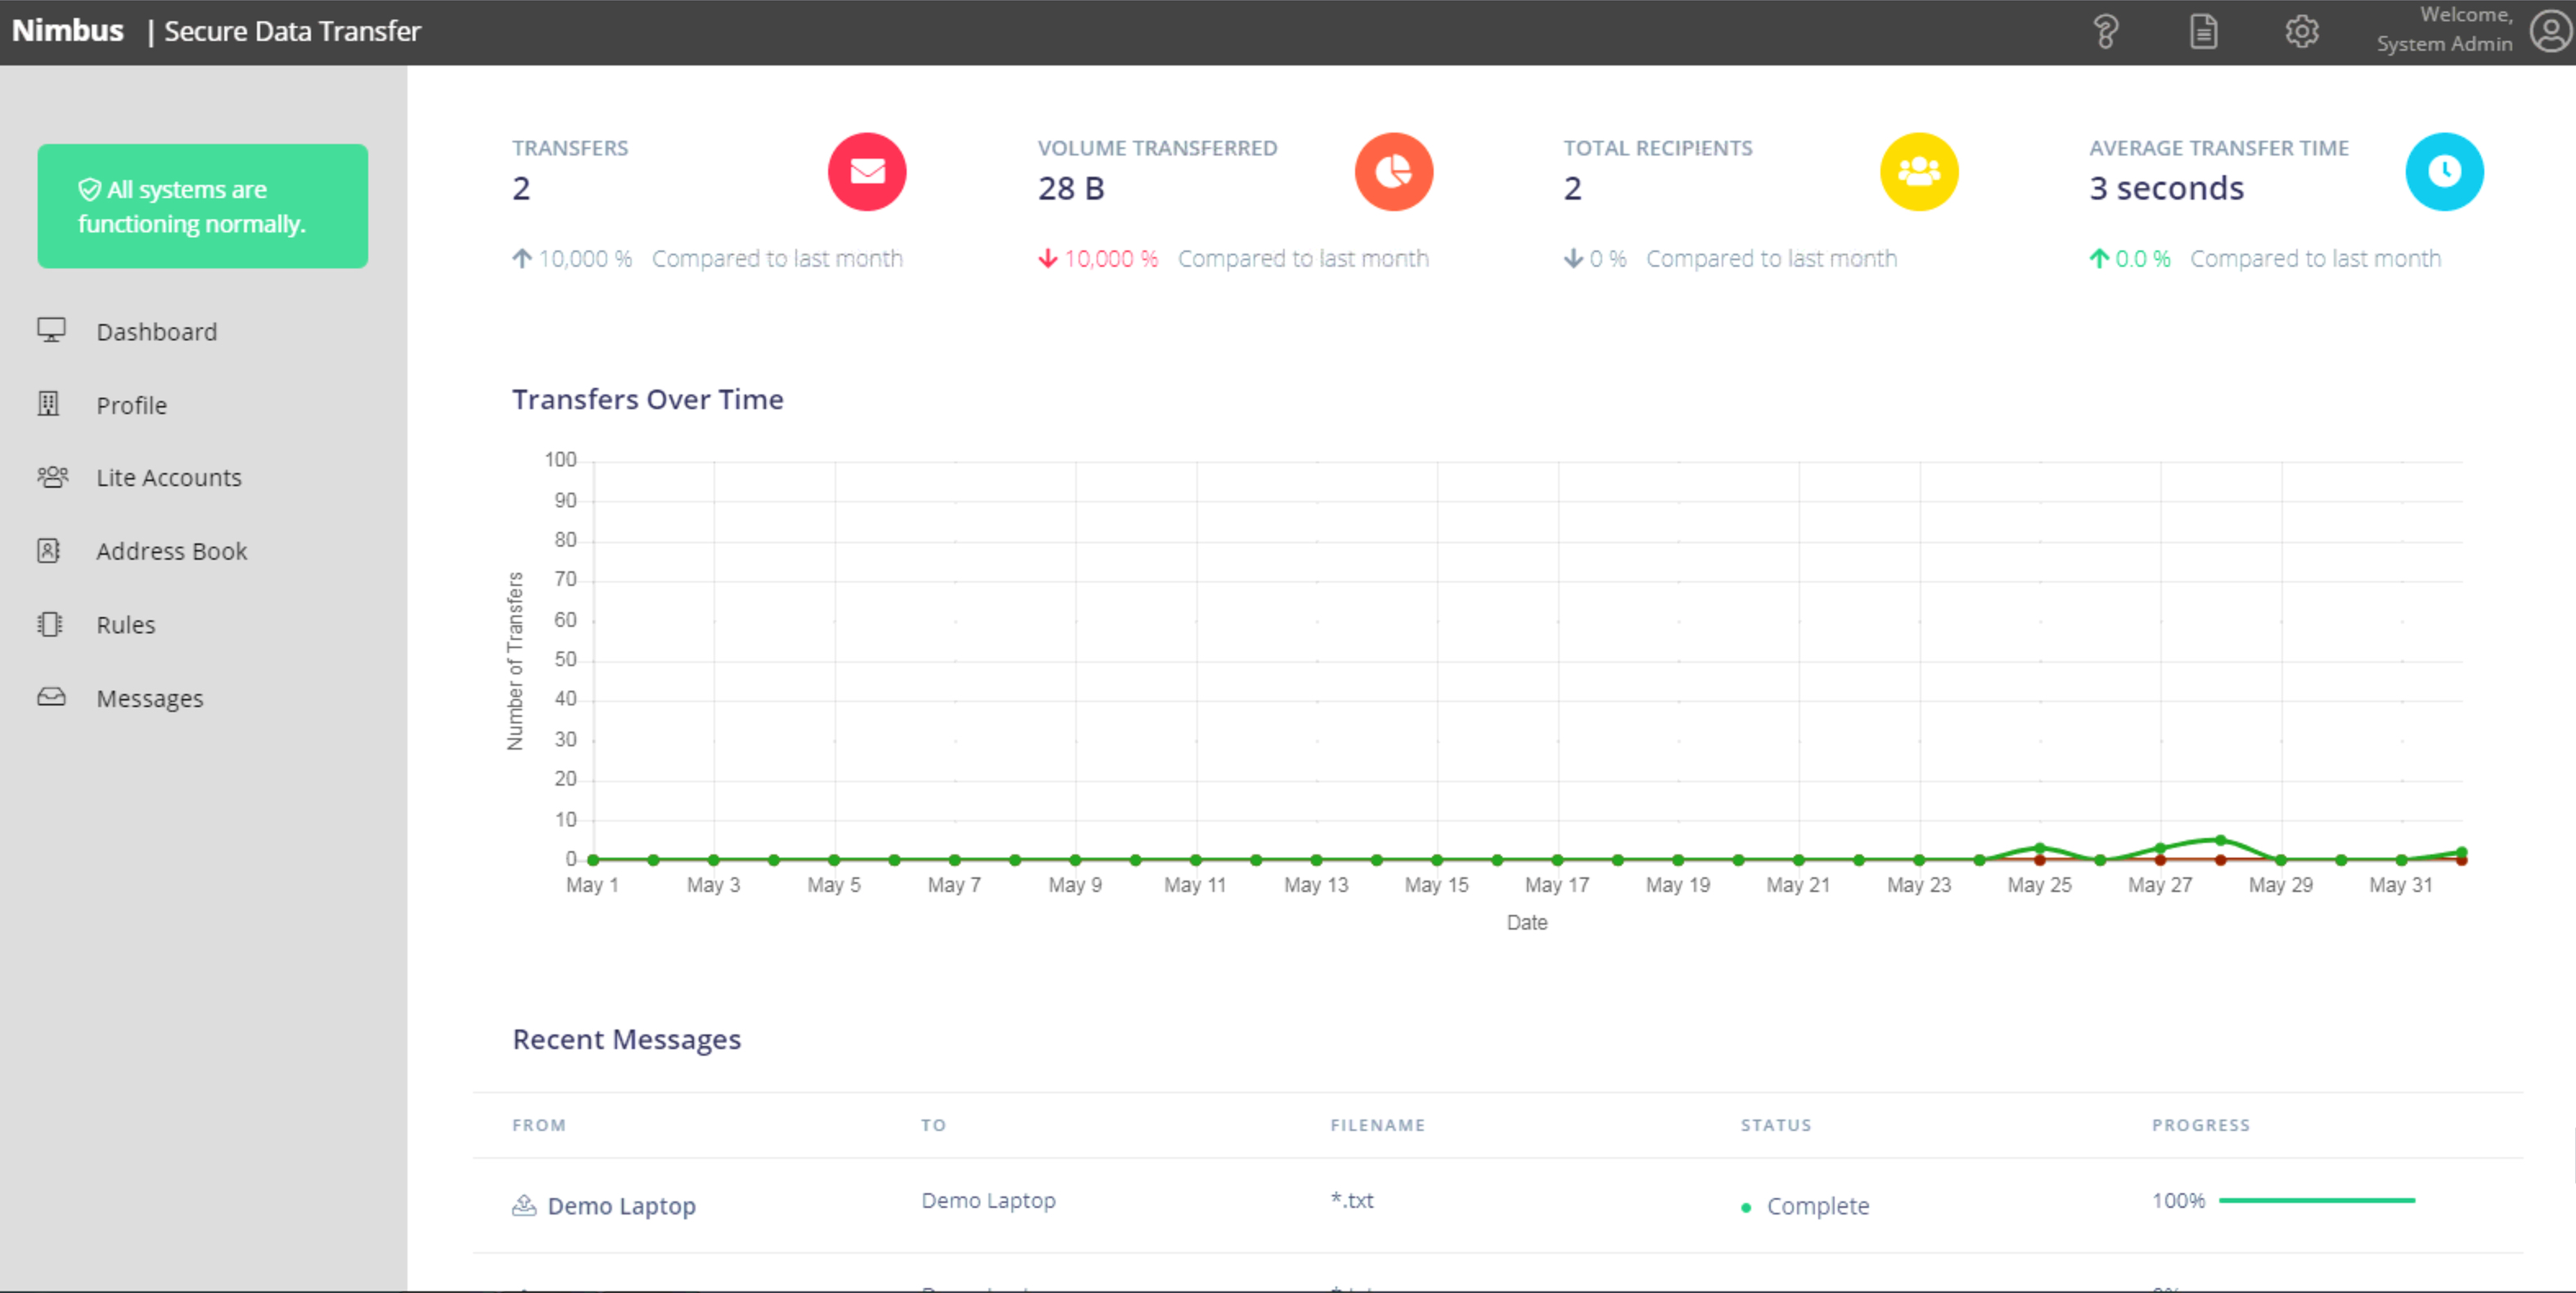
System Healthcheck - In the top left hand side, you should see "All systems are functioning normally". This means your Nimbus is up to date and can communicate with other Nimbus endpoints. This will change to a warning and advise of any issues, should they arise.
Transfers - This is the total number of transfers your Nimbus endpoint has performed in the current month.
Volume Transferred - This is the total file size transferred in the current month.
Total Recipients - This is the number of unique people you have sent files to in the current month.
Average Transfer Time - This is how long, on average a file transfer has taken in the current month.
Transfers Over Time - This graph shows the number of files sent and received, each day, for the current month.
Recent Messages - Shows the files processed in the last 24 hours.
← Login Address Book →